Real-time insights for better engagement
The Storycards analytics dashboard helps you track and understand your audience’s engagement levels.
Get started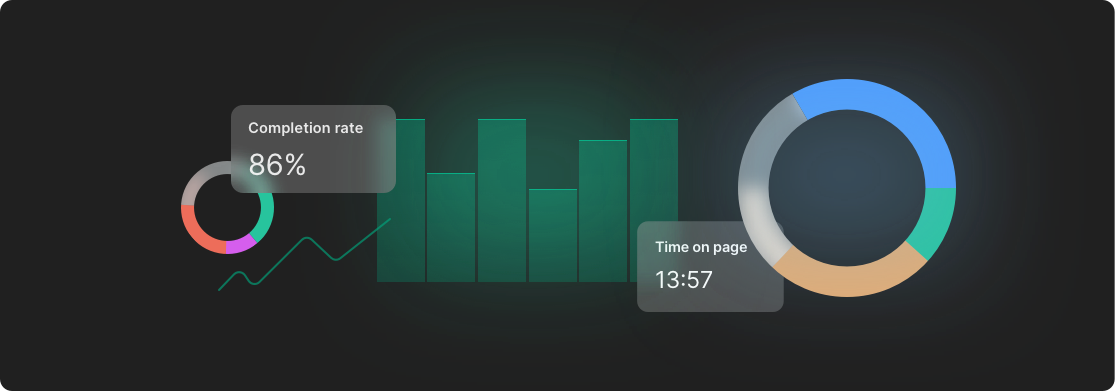
The Storycards analytics dashboard helps you track and understand your audience’s engagement levels.
Storycards analytics provides a complete breakdown of your data, tracking performance by stories and cards. Analyze user behavior, their choices, completion rates, and lead submissions to uncover what resonates with your audience.
Real time insights
Storycards analytics updates in real time, giving you instant feedback on how your story performs. Use these insights to make data-driven changes and boost engagement effectively.
Track drop-offs and optimize your flow
Identify drop-off points in your story, refine the user flow, and keep your audience engaged. Analyze performance data to make impactful adjustments and improve results.
Custom trackers
Integrate any analytics tool of your choice directly into your Storycards. Track the metrics that matter most to your business and gain complete control over your data.
Event tracking
Track custom user interactions, from clicks to form submissions, with tailored event tracking. Gain deeper insights into what drives engagement.
A/B testing insights
Compare variations of your stories to discover what works best. Use the data to refine your content and maximize engagement.
Device and platform analysis
Understand how users interact with your stories across devices and platforms. Optimize your design for mobile, desktop, or tablet to ensure seamless engagement everywhere.
Geographic performance
Track where your audience is located and understand engagement levels by region. Use these insights to tailor your content to specific locations.
Completion rate analytics
See how many users finish your stories and what might be causing drop-offs. Use this data to refine your storytelling for better engagement.
User journey mapping
Visualize how users navigate through your stories. Identify common paths, bottlenecks, and opportunities for improvement.
Exportable reports
Generate and download detailed analytics reports to share with your team or stakeholders. Get insights in a clear, actionable format.
Seamless Integration with Google Analytics
Integrate your Google Analytics account to track Storycards data and report custom events tailored to your needs.
Traffic source analysis
Identify where your users are coming from, whether it's organic search, paid ads, social media, or direct traffic. Understand which channels drive the best results.
Video engagement tracking
Monitor video performance with metrics such as average watch time, total views, and completion rates.
Social media engagement tracking
Track shares from your audience on social media to measure the social impact of your content.